Silver Deliveries in January Explode Higher
08 January 2026 — Thursday
YESTERDAY in GOLD, SILVER, PLATINUM and PALLADIUM
‘Da boyz’ stepped on gold’s rally — and the rallies in the other three precious metals…28 minutes after Globex trading began in New York on Tuesday evening — and from that juncture spent the rest of the Wednesday trading session overseas and in early COMEX trading in New York, beating it lower. Its spike low tick was set at 10:15 a.m. EST — and its ensuing rally was capped at 11:45 a.m. It was sold/engineered lower anew from that point until around 2:15 p.m. in after-hours trading — and it then struggled a bit higher until the market closed.
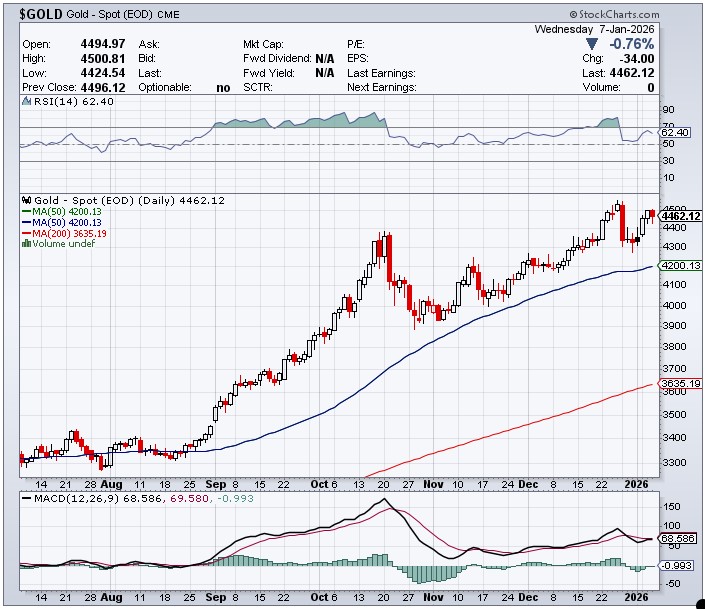
The high and low ticks in gold were reported by the CME Group as $4,512.40 and $4,432.90 in the February contract…and intraday move of $79.50 an ounce. The February/ April price spread differential in gold at the close in New York yesterday was $32.80…April/June was also $32.80 …June/August was $33.00 — and August/ October was 29.2 cents an ounce.
Gold was closed on Wednesday afternoon in New York at $4,455.50 spot…down $38.70 on the day — and $16.50 off its Kitco-recorded high tick. Net volume was only a touch on the heavier side at about 171,500 contracts — and there were a bit over 31,500 contracts worth of roll-over/switch volume on top of that.
I saw that 914 gold, plus an astonishing 2,089 silver contracts were traded in January yesterday — and I will certainly be more than interested in how much of this shows up in tonight’s Daily Delivery and Preliminary Reports…plus who the shorts and longs were.
Silver was up almost $1.40 by the time ‘da boyz’ stepped on its price at 6:28 p.m. EST in Globex trading in New York on Tuesday evening. It was then forced to trade ruler flat until Shanghai opened at 9:00 a.m. China Standard Time on their Wednesday morning — and they set its engineered low tick at the precise same time as gold’s…10:15 a.m. in COMEX trading in New York. Its ensuing rally attempt was capped at 12:00 o’clock noon right on the button — and was engineered lower anew until 1:15 p.m. EST. Its rally attempt after that wasn’t allowed to get far.
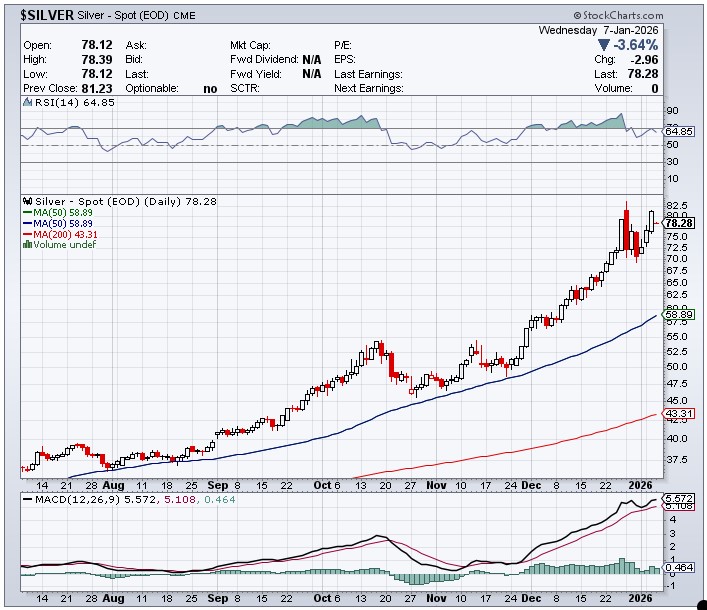
The high and low ticks in silver were recorded as $82.585 and $76.08 in the March contract…an intraday move of an eye-watering $6.505 an ounce. The March/ May price spread differential in silver at the close in New York yesterday was 59.8 cents…May/July was 60.4 cents — and July/ September was 54.1 cents an ounce.
Silver was closed in New York on Wednesday afternoon at $78.139 spot…down $3.05 on the day — and $1.83 off its Kitco-recorded low tick. Net volume was monstrous once again at a bit under 133,00 contracts — and there were about 21,500 contracts worth of roll-over/switch volume in this precious metal.
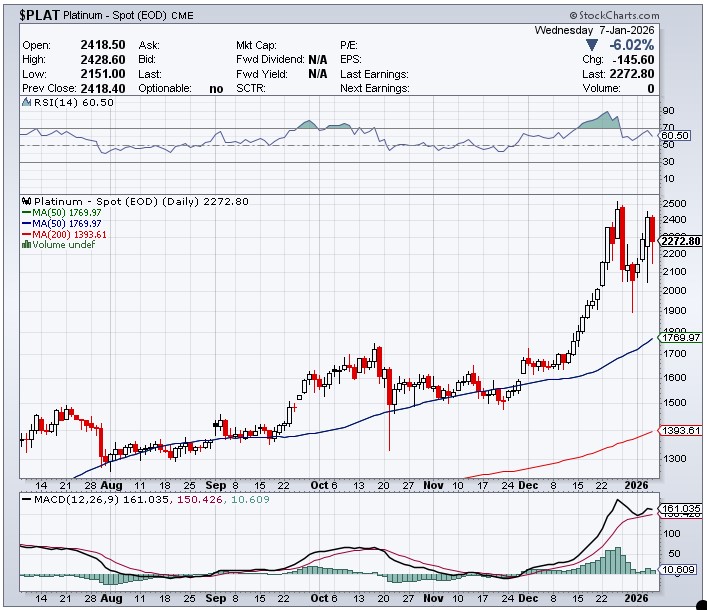
After platinum’s 6:28 p.m. EST high tick on Tuesday evening in New York, it was pretty much ‘lights out’ until the collusive commercial traders of whatever stripe/ ‘da boy’ also set its low tick around 10:15 a.m. in COMEX trading in New York on Wednesday morning. Like for silver, its ensuing rally was also capped and turned lower at exactly noon EST — and its price path after that was managed the same as silver’s as well…right up until the market closed at 5:00 p.m. EST. Platinum was closed at $2,300 on the button…down $137 on the day — and 61 bucks off its Kitco-recorded low tick.
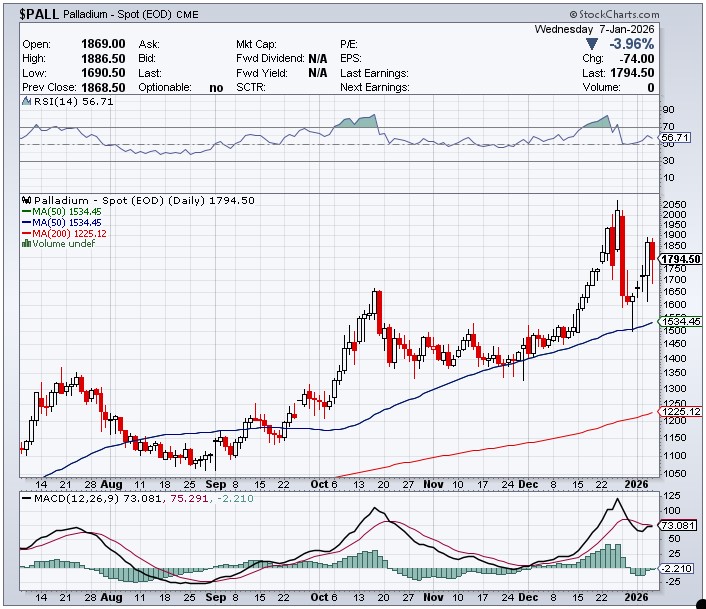
It was the same for palladium, except its engineered low tick was set around 9:20 a.m. in COMEX trading — and it then wandered quietly higher until ‘da boyz’ reappeared about ten minutes before trading ended at 5:00 p.m. EST. Palladium was closed at $1,744 spot…down 62 dollars on the day — and 57 bucks off its Kitco-recorded low tick.
Based on the kitco.com spot closing prices in silver and gold posted above…the gold silver/ratio worked out to 57.0 to 1 on Wednesday…compared to 55.4 to 1 on Tuesday.
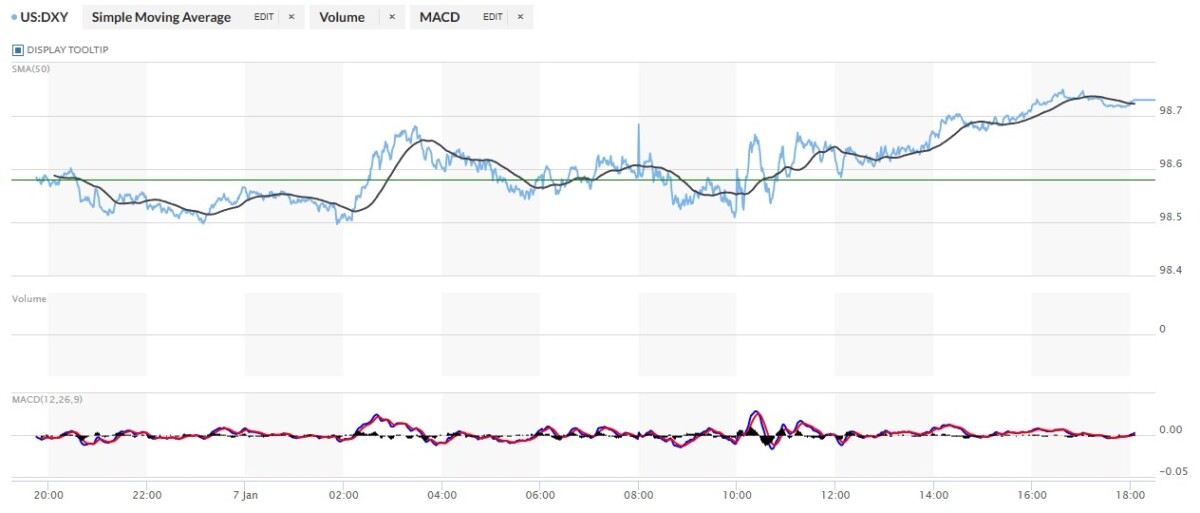
The dollar index closed very late on Tuesday afternoon in New York at 98.58 — and then opened unchanged once trading commenced at 7:45 p.m. EST on Tuesday evening…which was 8:45 a.m. China Standard Time on their Wednesday morning. It then wandered quietly lower until around 2:50 p.m. CST…rallied a bit until around 8:25 a.m. in London — and then chopped quietly lower until the 10 a.m. EST afternoon gold fix in London. It then proceeded to chop quietly higher until around 4:35 p.m. — and then drifted a tad lower until the market closed.
The dollar index finished the Wednesday trading session in New York at 98.68…up 10 basis points from its close on Tuesday — and 5 basis points below its indicated close on the DXY chart below.
Here’s the DXY chart for Wednesday…thanks to marketwatch.com as always and, if interested, the above-mentioned discrepancy should be noted. Click to enlarge.
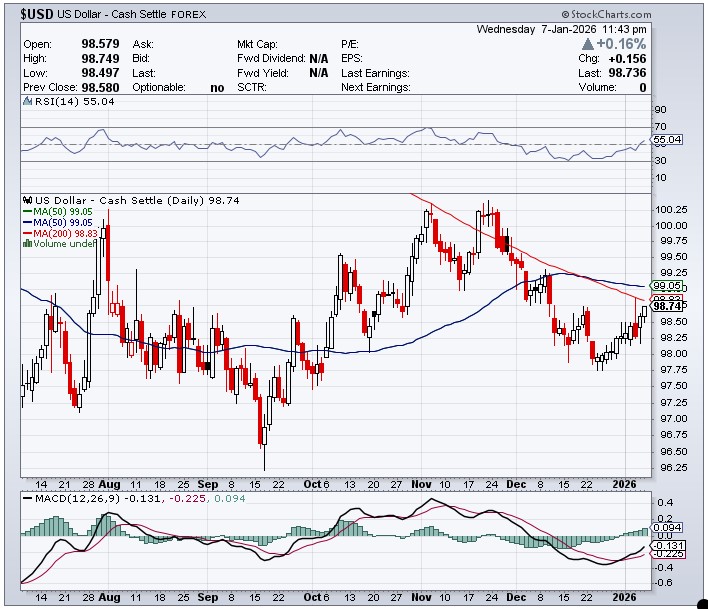
Here’s the 6-month U.S. dollar index chart…courtesy of stockcharts.com as always. The delta between its close…98.74…and the close on DXY chart above, was 6 basis points above that. The rally in the dollar index that began around Christmas is now coming close to breaking above its 200-day moving average…as you can see from this chart. I’ll have a bit more in this in The Wrap. Click to enlarge.
The lead story on Sharps Pixley yesterday read “Gold retreats from weekly high following dollar surge” What a pile of crap that is. If you truly believe that, dear reader, you shouldn’t be reading what I’m writing. But before you cancel your subscription, I do have a bridge for you at a very good price!
U.S. 10-year Treasury: 4.1380%…down 0.0410/(-0.98%)…as of the 1:59:53 p.m. CDT close
The ten-year was heading higher until the Fed quietly stepped in around 10:25 a.m. EST on Wednesday morning.
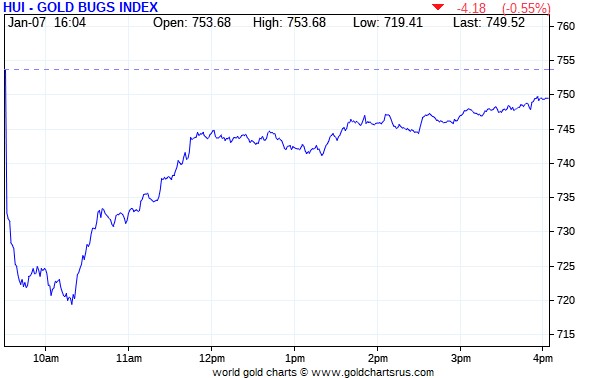
Not surprisingly, the gold shares gapped down at the 9:30 opens of the equity markets in New York on Wednesday morning — and then kept on going lower until 10:15 a.m. EST. They then rallied impressively [along with the gold price] until ‘da boyz’ stepped on gold’s rally at 11:45 a.m. They then drifted a bit lower until 1:15 p.m. when gold bottomed out — and then crawled quietly higher until the markets closed at 4:00 p.m. EST. The HUI closed down only 0.55 percent.
The silver equities crashed until 9:45 a.m. — and then had a quiet up/down move that ended at 10:18 a.m. From that juncture their price paths were identical to the gold shares, except for the fact that Nick Laird’s Silver Sentiment Index got clocked by 3.01 percent. Click to enlarge.
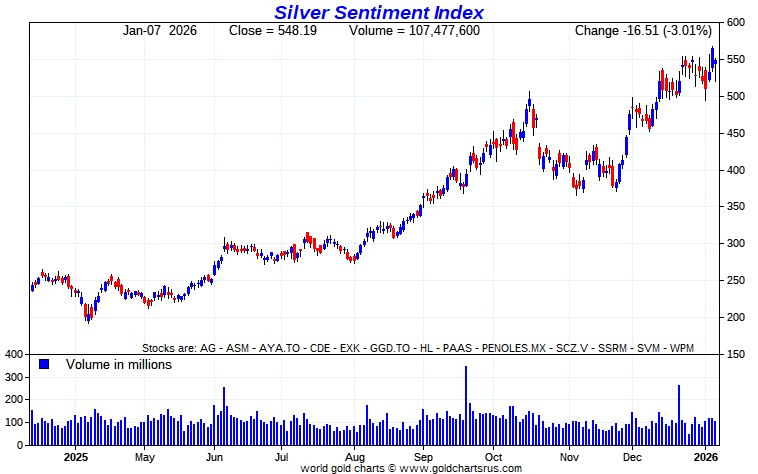
The ‘star’ was GoGold Resources, as it closed down only 0.97 percent. The biggest underperformer of many was Endeavour Silver, as it got beaten up to the tune of 4.91 percent.
I didn’t see any news on the thirteen silver stocks that make up the above Silver Sentiment Index.
The silver price premium in Shanghai over the U.S. spot price on Wednesday dropped down to 7.68 percent.
The reddit.com/Wallstreetsilver website, now under ‘new’ and somewhat improved management, is linked here. The link to two other silver forums are here — and here.
The CME Daily Delivery Report for Day 6 of January deliveries showed that 357 gold, plus a whopping 1,624 silver contracts were posted for delivery within the COMEX-approved depositories on Friday.
In gold, the two short/issuers were Australia’s Macquarie Futures and BofA Securities, issuing 200 and 157 contracts out of their respective house accounts. The largest long/stopper by far was Deutsche Bank, picking up 223 contracts for their house account. The next two biggest down the list were JPMorgan and Canada’s Scotia Capital/Scotiabank…stopping 91 and 23 contracts respectively…the latter for their own account, as they don’t have a client account.
In silver, the only one of the three short/issuers that mattered was JPMorgan, issuing 1,611 contracts out of its client account. The three largest long/stoppers were Deutsche Bank, Wells Fargo and Australia’s Macquarie Futures…picking up 476, 379 and 245 contracts — and all for their respective house accounts. The next two down the list were BofA Securities and JPMorgan…stopping 149 and 135 contracts respectively…BofA for their house account.
In platinum, there were 54 contracts issued and stopped.
The rush for copper continues, as a further 596 contracts/14.9 million pounds were issued and stopped yesterday.
The link to yesterday’s Issuers and Stoppers Report is here.
The CME Preliminary Report for the Wednesday trading session showed that gold open interest in January increased by 588 COMEX contracts, leaving 1,433 still around…minus the 357 contracts out for delivery on Friday as mentioned in the above Daily Delivery Report. Tuesday’s Daily Delivery Report showed that 234 gold contracts were actually posted for delivery today, so that means that 588+234=822 more gold contracts were added to January deliveries.
Silver o.i. in January rose by 1,431 contracts, leaving 2,155 still open…minus the 1,624 contracts out for delivery on Friday as mentioned a few paragraphs ago. Tuesday’s Daily Delivery Report showed that 150 silver contracts were actually posted for delivery today, so that means that 1,431+150=1,581 more silver contracts were added to January deliveries…which is a whole heck of a lot…a bit more that 13 truckloads of the stuff.
Total gold open interest in the Preliminary Report on Wednesday night increased by 1,463 COMEX contracts. Total silver o.i. rose by 1,160 contracts…both surprising numbers considering that both precious metals were closed down decent amounts on the day…silver in particular.
[I checked the final total open interest number for gold for Tuesday — and it was only down a little bit…from +8,672 COMEX contracts, down to +7,575 COMEX contracts. Final total silver o.i. for Tuesday also fell by a tad…from +931 COMEX contracts…down to +763 contracts.]
Gold open interest in February in the CME’s Final Report on Wednesday morning increased by 1,902 contracts, leaving 323,348 COMEX contracts still around — but silver o.i. in February declined by 62 COMEX contracts, leaving 1,859 still open.
There were no reported changes in GLD yesterday — and an authorized participant added 39,588 troy ounces of gold to GLDM. An authorized participant removed a further 589,242 troy ounces/one truckload of silver from SLV.
The SLV borrow rate didn’t show a reading for the second day in a row. The last reading was on Monday morning, where it showed 0.70% with 10.0 million shares available to short. The GLD borrow rate began the Wednesday session at 0.56% — and also finished it at 0.56%…with 8.4 million shares available.
There’s this interesting note about the borrow rates that I overlooked until now. It reads “Data from Interactive Brokers. IBKR publishes an updated file every 15 minutes. If there’s no update, there aren’t any shares available.”
In other gold and silver ETFs and mutual funds on Earth on Wednesday …net of any changes in COMEX, GLD, GLDM and SLV activity, there were a net 77,443 troy ounces of gold added…but a net 372,549 troy ounces of silver were taken out. The big action in silver were the 4,132,696 troy ounces that left Aberdeen — and the 3,305,966 troy ounces added to GlobalX ETFs/ETPMAG. But not to be overlooked were the 997,791 troy ounces of silver added to Sprott’s PSLV.
And nothing from the U.S. Mint — and there won’t be anything now until February, as they now only report sales once a month…instead of daily like they used to.
For the second day in a row there was no in/out activity in gold over at the COMEX-approved depositories on the U.S. east coast on Tuesday. There was a bit of paper activity, as 16,858 troy ounces were transferred from the Eligible category and into Registered over at Loomis International — and no doubt going out for immediate delivery. There were also 578.718 troy ounces/18 kilobars transferred from the Registered category and back into Eligible over at Brink’s, Inc. The link to this is here.
But there was no let-up in silver. There were 4,940 troy ounces received/one COMEX contract over at CNT — and 2,278,215 troy ounces were shipped out. The two largest ‘out’ amounts were the 1,285,793 troy ounces that left JPMorgan…followed by the 607,984 troy ounces/one truckload that departed Loomis International.
There was also huge paper activity, as 1,200,585 troy ounces/two truckloads were adjusted out of existence over at Brink’s, Inc. The remaining 5,093 troy ounces/ one COMEX contract were transferred from the Registered category and back into Eligible over at JPMorgan.
The link to all of Tuesday’s considerable COMEX silver action is here.
The Shanghai Futures Exchange updated their silver inventories as of the close of business on their Wednesday — and it showed that a net and further 900,453 troy ounces/28.007 metric tonnes were removed… leaving their silver inventories at 17.793 million troy ounces/553.429 metric tonnes.
In a note I received from Nick Laird late yesterday afternoon, he pointed out that China added 0.930 tonnes/29,900 troy ounces of gold to their reserves in December…which now stand at 2,306 tonnes/74.140 million troy ounces. Most pundits believe…including yours truly…that their real gold reserves are at least ten times that amount.
CRITICAL READS & VIDEOS
Job Openings Plunge Below Lowest Estimate As Government Openings Crater; Hiring Plummets
While today’s ADP report was a solid rebound from the worst monthly report in years (even if it missed expectations due to a sudden plunge in California payrolls), the same could not be said for the JOLTS job opening report that followed less than two hours later, and which was another epic disaster: for the month of November (recall JOLTS lags the payrolls report by a month), the U.S. had only 7.146 million job openings, a huge drop from the 7.670 million in October (which was conveniently revised lower to 7.449 million) and the lowest since September 2024.
The November print was also a 3+ sigma miss to expectations and came in below the lowest estimate (that of TD Securities).
According to the BLS, the number of job openings decreased in accommodation and food services (-148,000); transportation, warehousing, and utilities (-108,000); and wholesale trade (-63,000). Job openings increased in construction (+90,000).
But the most notable drop by far, was that in government, where the number of workers collapsed to the lowest level since early 2021.
Meanwhile, after four years of the U.S. labor market dodging the bullet, its luck has finally run out because while until just a few months ago, the labor market was supply-constrained, with more job openings than unemployed workers in the U.S., in November we are finally back to sharply demand constrained, with 685k fewer job openings than unemployed workers, the most since March 2021…
Putting it all together, despite a rather solid ADP print earlier, today’s JOLTS report was quite terrible and certainly enough to ensure that Fed rate cuts continue (assuming no dramatic improvement in Friday’s job report). The flip side, of course, is that this report took place when the government was still mostly shut down, so our advice would be to just ignore everything since it is not indicative of the current state of the U.S. economy after it reopened shortly after Democrats capitulated without achieving anything.
This multi-chart Zero Hedge news items was posted on their website at 11:02 a.m. on Wednesday morning EST — and another link to it is here.
Back to Barbarity — Bill Bonner
Human history is like a pendulum, swinging back and forth between progress and retrogression…prosperity and poverty…civilization and barbarity
On to Greenland! CBS News:
White House discussing range of options for acquiring Greenland, Leavitt says.
But whoa. Let’s slow down. We look back to the ‘indictment’ of Nicolas Maduro for a residue of ‘due process of law.’ He is to be tried by a legitimate court on legitimate charges. No mention of Fentanyl. No reference to the mythical group, Cartel de los Soles. Nothing about stealing oil. Instead, he’s charged with conspiracy to distribute cocaine.
Everyone knows the supply of cocaine in the U.S. will not go down, not by one jot or tittle, thanks to this headline kidnapping. But that is the advantage of asymmetric power. You don’t have to justify your actions. We kidnap them; they don’t kidnap us. We bomb Nigerians; they don’t bomb us. We lay down the law…and then walk all over it. We don’t need a good excuse.
Another example is America’s partner, Israel. With U.S. backing, last year, Israel attacked Palestine, Iran, Lebanon, Qatar, Syria and Yemen. It also carried out strikes against flotillas that were trying to bring aid to Gaza. The number of attacks was breath-taking — a total of 10,631 up to December 5th, 2025. You can’t do that unless you’re pretty sure they can’t strike back.
In human affairs, progress, if there is any, is tentative and cyclical. After WWII, steps were taken toward a more foreseeable, and more civilized, world. The U.S. Department of War was renamed the Department of Defense in 1947. The United Nations Declaration of Human Rights was put forward in 1948. The Geneva Convention came out in 1949. All were intended to avoid another WWII-type bloodbath..
Trump’s re-re-renaming of the War Department tells us all we need to know about the direction this administration is headed. It is leading a counter-trend, returning to an era where nations use their power to get what they want. The Trump team bombs Nigeria and kidnaps the first couple of Venezuela not because it is fulfilling the law, but because it is thumbing its nose at it.
This worthwhile commentary from Bill showed up on the Internet on Wednesday morning EST — and I thank Roy Stephens for sending it our way. Another link to it is here.
America’s Biggest Foreign Policy Mistake Just Blew Up in Venezuela — Colonel Larry Wilkerson
This longish and very informative 57-minute video interview with the Colonel was hosted by Nima Alkhorshid. It was posted on the youtube.com Internet site on Monday — and another link to it is here.
QUOTE of the DAY

The WRAP
It should be obvious that the precious metals were about to go supernova in early Globex trading in New York on Tuesday evening — and the collusive commercial traders of whatever stripe were forced to step in yet again to prevent Ted Butler’s “Bonfire of the Silver Shorts” from manifesting itself. They were none to subtle about it, either…beating them all lower until early COMEX trading in New York on Wednesday morning.
Any speculator that went long on margin on Tuesday in either the COMEX futures market, or in the precious metal equities, got blown out on Wednesday. The sole purpose of this bear raid by ‘da boyz’ was to break the upside momentum, which worked fine for the moment. But all the world’s investors are now familiar with this game — and the respite ‘da boyz’ gained yesterday, isn’t going to last long.
As I mentioned recently, the silver price genie is out of the bottle for good — and the exact same thing can be said of the other three precious metals as well. As for how long this newly-minted ‘wash, rinse & spin’ cycle is going to last…who knows.
However, I did point out in my discussion on the dollar index further up, that its ‘rally’ that began around Christmas time, may be the fig leaf they hide behind as these engineered price declines proceed. Up until the bear raid by ‘da boyz’ ten days ago — and again yesterday, this hadn’t been going according to plan…as the precious metals were rallying aggressively regardless of that fact. Maybe they’ll have more ‘luck’ this time.
Of course — and not to be forgotten is the following: The Bloomberg Commodity Index (BCOM) annual rebalancing begins today, January 8 — and runs through January 14…which is another skirt that the collusive commercial traders of whatever stripe can hide behind.
Remember, as Ted Butler correctly pointed out on many occasions, there are myriad reasons why precious metal prices should be far higher than then they are now…silver in particular — and only one reason why they’re not…’da boyz.’
All four precious metals are a very long way above any moving averages that matter — and it’s a given that ‘da boyz’ don’t have enough fire power to get near any of them…although one must never underestimate their treachery.
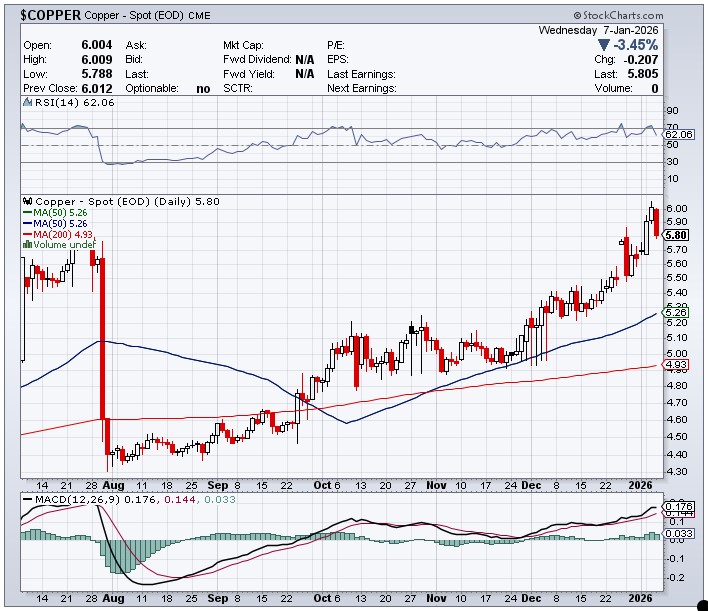
Copper’s sojourn above $6 was fleeting, as it got engineered lower by 20.7 cents/ 3.45% — and was closed at $5.80/pound…taking back all of Tuesday’s gain, plus half of Monday’s in the process.
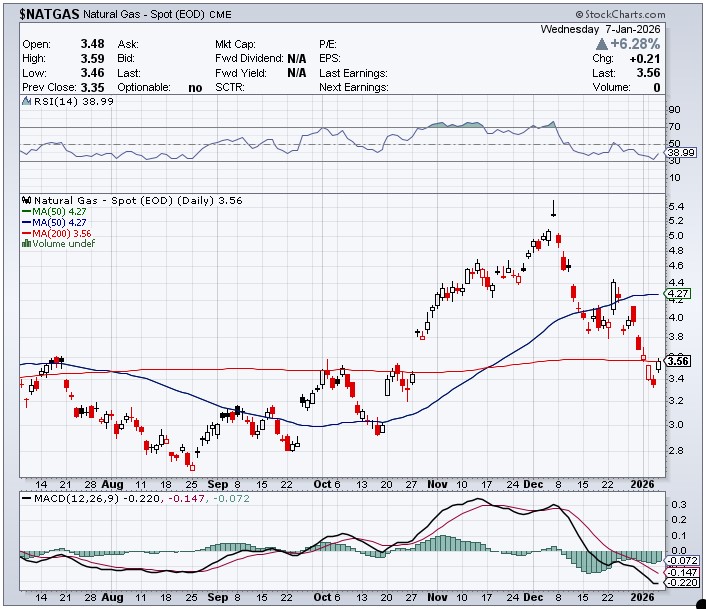
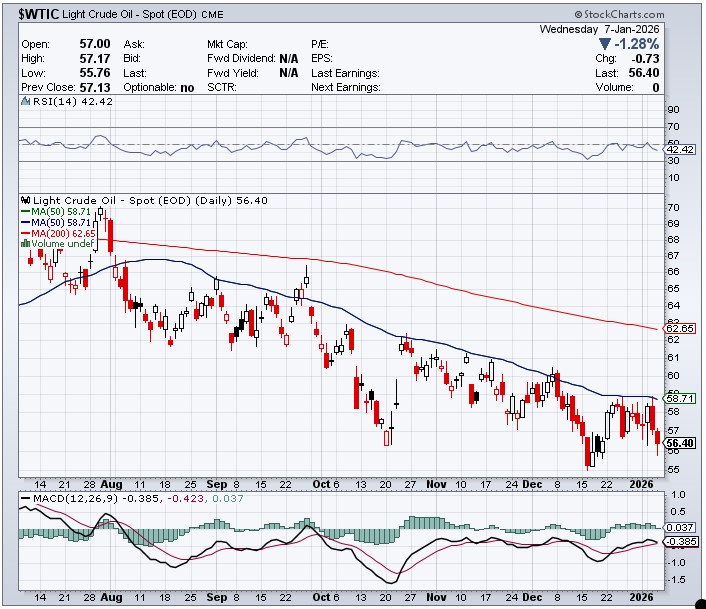
Natural gas [chart included] caught a bid yesterday…closing up 21 cents/6.28% at $3.56/1,000 cubic feet — and managed to poke its nose above its 200-day moving average intraday on Wednesday. WTIC took another big hit, as it was closed down a further 73 cents at $56.40/barrel — and was below 56 bucks intraday yesterday.
Here are the 6-month charts for the Big 6+1 commodities as of the COMEX close yesterday…thanks to stockcharts.com as always. Once again the silver chart only shows the COMEX closing price for Wednesday — and not its intraday move. That will be fixed sometime today. Click to enlarge.
The big surprise yesterday, featured in today’s headline, that ran concurrently with the engineered price declines in the four precious metals and copper, was the blow-out January volume traded in the COMEX futures market.
That resulted in another 822 gold…plus 1,581 silver contracts getting added to the January delivery month, as pointed out in the Preliminary Report further up.
And as I hit the ‘Publish’ button on today’s missive, I see that 631 gold, plus 1,053 silver contracts have traded in January already on Wednesday. Heaven only knows what those amounts will be by the time I roll out of bed around noon EST today.
So the rush for physical metal has jumped up a couple of notches in the last few days — as their prices get whacked at that same time. Interesting and historic times for sure.
And as I finish up on today’s efforts, the London/Zurich Globex opens are less than a minute away — and I see that for the second day in a row the rallies in all four precious metals ran into ‘da boyz’ shortly after 6 p.m. on Wednesday evening in New York. Gold’s current engineered low tick was set just before 2 p.m. China Standard Time on their Thursday — and the other three around the 2:15 p.m. afternoon gold fix in Shanghai. All are off their lows by a bit now.
At the moment, they have gold down $24.50 the ounce — and silver by $2.25 an ounce as London opens. Platinum and palladium are lower by 95 and 37 dollar respectively as Zurich opens.
Gross gold volume is a bit over 47,500 contracts — and minus current roll-over/switch volume, net HFT gold volume is a bit over 42,000 contracts. Net HFT silver volume is very hefty yet again at a bit over 32,000 contracts — and there are about 4,100 contracts worth of roll-over/switch volume in this precious metal.
The dollar index closed very late on Wednesday afternoon in New York at 98.68 — and the opened higher by 6 basis points once trading commenced at 7:45 p.m. EST on Wednesday evening…which was 8:45 a.m. China Standard Time on their Thursday morning. It has been wandering very quietly sideways since — and as of 7:45 a.m. GMT in London/8:45 a.m. CET in Zurich, the index is up 4 basis points. Nothing to see here once again.
That’s it for another day. We get the non-farm payroll number tomorrow at 8:30 a.m. EST and, without doubt, it will ‘move’ the precious metals.
Ed